
BI Analyst
Course in Hyderabad
A role-focused path through the Data Science Certification Program
This role course arranges the Data Science programme around a BI analyst. Power BI and Tableau come first, supported by SQL, exploratory analysis and Python charting, plus the statistics you need to say whether a KPI has really moved. You practise building and presenting dashboards.
- Power BI dashboards
- Tableau views
- DAX basics
- KPI tracking
- SQL joins
- Data profiling
- Plotly charts
- Stakeholder presenting
Same duration and fees as the Data Science programme.
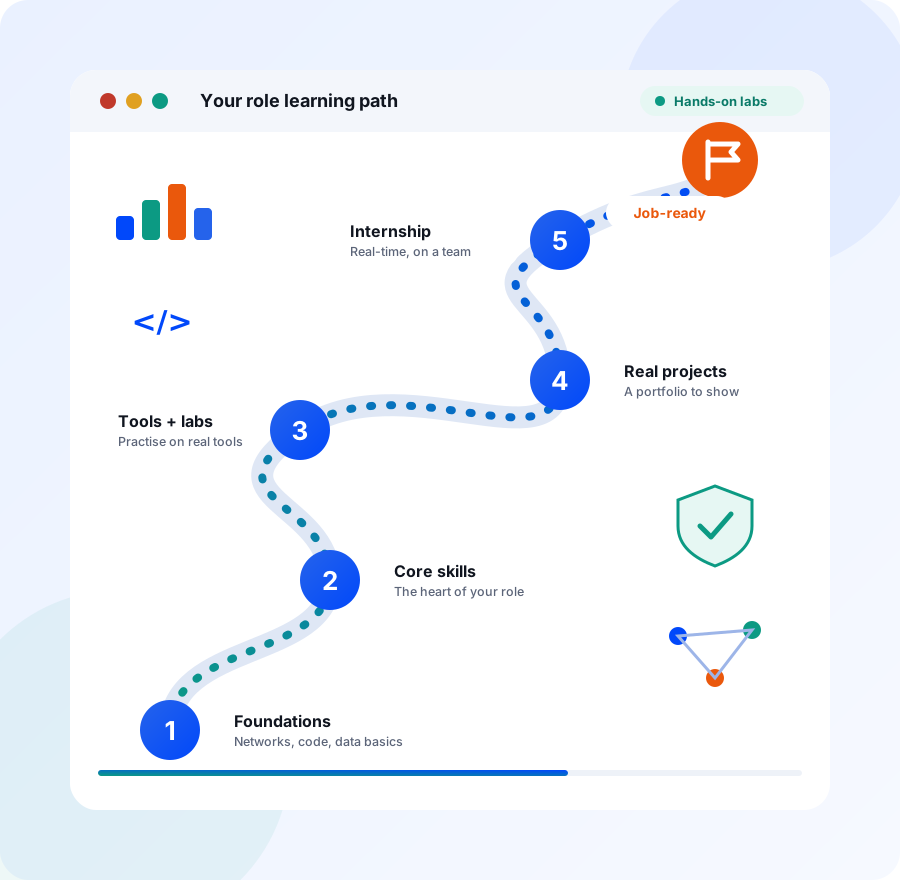
What a BI Analyst does
A BI analyst builds the dashboards and reports that a business uses to run itself. Sales, finance, operations and support teams all track numbers such as orders, delays, revenue and tickets. The BI analyst connects the data, decides which measures matter, and builds views that people can filter and drill into without asking for a new report each time. It is a role about clarity and reliability more than about complex models.
Most weeks begin with a request such as seeing sales by region and by month. You confirm what the numbers mean, connect the sources, write a query or a DAX measure, build the page and test it against a known figure. After launch you keep it running, fix broken refreshes, answer questions about definitions and adjust the layout when leaders say the page is too crowded.
BI analysts work in almost every large organisation: retail, banking, manufacturing, healthcare, telecom, IT services and start-ups with a growing customer base. The role matters because managers rarely open notebooks. They open dashboards, and they make decisions from what they see. A dashboard with wrong or unclear numbers can mislead a whole team, so care and clear definitions count for as much as design.
What you will be able to do
- Explain business intelligence concepts and dashboard design principles to a non-technical manager.
- Connect and import several data sources into a Power BI or Tableau report.
- Build interactive dashboards with filters, drill-down analysis and KPI views.
- Write basic DAX measures and Tableau calculated fields for common business questions.
- Extract and prepare the data behind a dashboard using SQL joins and group-by queries.
- Choose a chart that fits the question and avoid layouts that mislead.
- Publish a dashboard and present its insights clearly to a stakeholder group.
- Judge whether a change in a KPI is meaningful using basic hypothesis testing.
Who this course is for
Recent graduate
You want a business-facing data job without heavy programming. Dashboards give you visible work to show, and the SQL and exploratory analysis modules give you the base you need behind them.
Excel power user in finance or MIS
You already build reports by hand and know the pain of monthly refreshes. Power BI and Tableau let you turn that work into dashboards that update on their own and reach more people.
IT support engineer
You know the systems and the people who use them. Moving into BI lets you use that knowledge to build dashboards on tickets, uptime and service levels, once you have learned SQL and dashboard design.
Non-IT graduate or career switcher
You have business knowledge from sales, HR or operations and want a technical role. Your understanding of what the numbers mean is an advantage, and the course teaches the tools step by step.
What you will learn as a BI Analyst
These are the Data Science programme modules that matter most for this role, in the order that suits it. Every topic, tool and lab below is part of the programme syllabus.
Business Intelligence Tools (Power BI / Tableau)
Module 6 · 20 HrsThis module defines the role. Concentrate on dashboard design principles, connecting sources, DAX measures, Tableau calculated fields, KPI tracking and publishing, and spend extra time on presenting the result to a stakeholder.
See the full module →What you study
- BI concepts & dashboard design principles
- Connecting & importing data sources
- Building interactive dashboards & reports
- DAX basics in Power BI
- Calculated fields & filters in Tableau
- KPI tracking & drill-down analysis
- Presenting insights to stakeholders
Tools you use
Power BITableauExcelHands-on project
BI Dashboard Build. Design an interactive Power BI or Tableau dashboard for a real business use case.
Data Wrangling (SQL + Cleaning)
Module 3 · 20 HrsEvery dashboard sits on a query. Focus on joins, group-by summaries, reshaping and building clean tables, so the numbers on the page match the source and you can prove it when someone asks.
See the full module →What you study
- Relational databases & SQL fundamentals
- SELECT, JOIN, GROUP BY & subqueries
- Handling missing values & duplicates
- Merging, reshaping & pivoting datasets
- Building clean, analysis-ready datasets
Tools you use
SQLMySQL / PostgreSQLPandasHands-on lab
Write SQL queries using SELECT, JOIN, GROUP BY and subqueries against a real database.
Exploratory Data Analysis (EDA)
Module 4 · 20 HrsBefore you design a page, explore the data behind it. Practise profiling, checking correlations and spotting anomalies, so you know which measures deserve a place on the dashboard and which are noise.
See the full module →What you study
- Univariate, bivariate & multivariate analysis
- Summary statistics & data profiling
- Identifying patterns, trends & anomalies
- Correlation analysis between variables
- Communicating early insights clearly
Tools you use
PandasJupyter NotebookPandas ProfilingHands-on lab
Document and present exploratory findings in a clear, structured brief.
Data Visualization (Matplotlib / Seaborn)
Module 5 · 20 HrsPython charting complements the BI tools. Learn chart selection, storytelling and dashboard layout in Matplotlib, Seaborn and Plotly, which helps when an analysis needs more control than drag-and-drop offers.
See the full module →What you study
- Principles of effective data visualization
- Line, bar, scatter & histogram plots
- Seaborn statistical plots & heatmaps
- Storytelling with data
- Choosing the right chart for the data
- Building simple visualization dashboards
Tools you use
MatplotlibSeabornPlotlyHands-on lab
Choose and justify the right chart type for a given analytical question.
Mathematics for Data Science
Module 1 · 20 HrsA KPI that moved may mean nothing. Use descriptive statistics, hypothesis testing and confidence intervals to decide whether a change is real before you put it in front of leadership.
See the full module →What you study
- Probability & statistics fundamentals
- Descriptive statistics & distributions
- Hypothesis testing & confidence intervals
- Correlation & regression basics
- Statistical inference for data decisions
Tools you use
ExcelGoogle SheetsHands-on lab
Run a hypothesis test and interpret a confidence interval on sample data.
What the programme covers for this role. The programme covers Power BI and Tableau dashboards, basic DAX, KPI tracking and the SQL behind them. Data warehouse design and advanced DAX modelling are outside the syllabus.
Where a BI Analyst course can take you
First jobs
Business Intelligence Analyst, Reporting Analyst, Data Visualization Analyst and Data Analyst are the entry titles the programme points to for dashboard work, along with Analytics Consultant (Trainee).
Next steps
With a few dashboards in real use, you can take on Insights Analyst or Product Analyst work, owning the metrics for one team or product and advising on what else to measure.
Wider paths
The Data Analysis and BI track can lead toward Analytics Consultant roles that advise several teams. If you enjoy modelling, add machine learning and move toward Junior Data Scientist.
Certifications the programme prepares you for
- Microsoft Certified: Power BI Data Analyst Associate
- Tableau Desktop Specialist
- Google Data Analytics Professional Certificate
BI Analyst course, quick answers
Is Power BI or Tableau better for a BI analyst?
Both are common, so the course teaches both. Power BI adds DAX measures, while Tableau focuses on calculated fields and drill-down views. Learning the two side by side helps you understand dashboards in general, so switching tools later is easier.
Do I need SQL to work as a BI analyst?
In most teams, yes. Dashboards sit on data that lives in databases, so you need SELECT, JOIN and GROUP BY to pull and check it. The programme has a full module on SQL and cleaning, with practice on MySQL or PostgreSQL.
What is DAX and how much of it do I need?
DAX is the formula language in Power BI for measures such as totals, ratios and comparisons. The syllabus covers the basics, which is enough to build useful reports and KPI views. Deeper modelling is something you can study once you are working.
What should a BI analyst portfolio include?
One or two complete dashboards for a realistic business case, each with the source data, the questions it answers and a short note on how to use it. The BI dashboard project in the course is a good starting piece, and screenshots help.
Do BI analysts need statistics and Python?
They are not needed for every dashboard, but they help. Basic statistics tells you whether a KPI change is meaningful, and Python charting handles analysis that a dashboard tool does poorly. This course covers both, so you are not limited to drag-and-drop work.
Get the BI Analyst Course Fee Structure & Syllabus
Share your details and our admissions team will call you back with the full syllabus, batch timings and fee breakdown.
Read before you decide
Other roles in the Data Science programme
Part of the Advanced Data Science Certification Program
Every role course follows the same Data Science programme, with the same modules, labs, projects and internship. See the full syllabus and every module.