
Analytics Consultant
Course in Hyderabad
A role-focused path through the Data Science Certification Program
This role course arranges the Data Science programme around an analytics consultant. You learn to explore data with a clear question in mind, back your view with statistics, present it in charts and dashboards, and understand where machine learning can and cannot help a client.
- Hypothesis-driven analysis
- Statistical inference
- Exploratory analysis
- Data storytelling
- Chart selection
- Power BI or Tableau
- KPI dashboards
- Presenting insights
Same duration and fees as the Data Science programme.
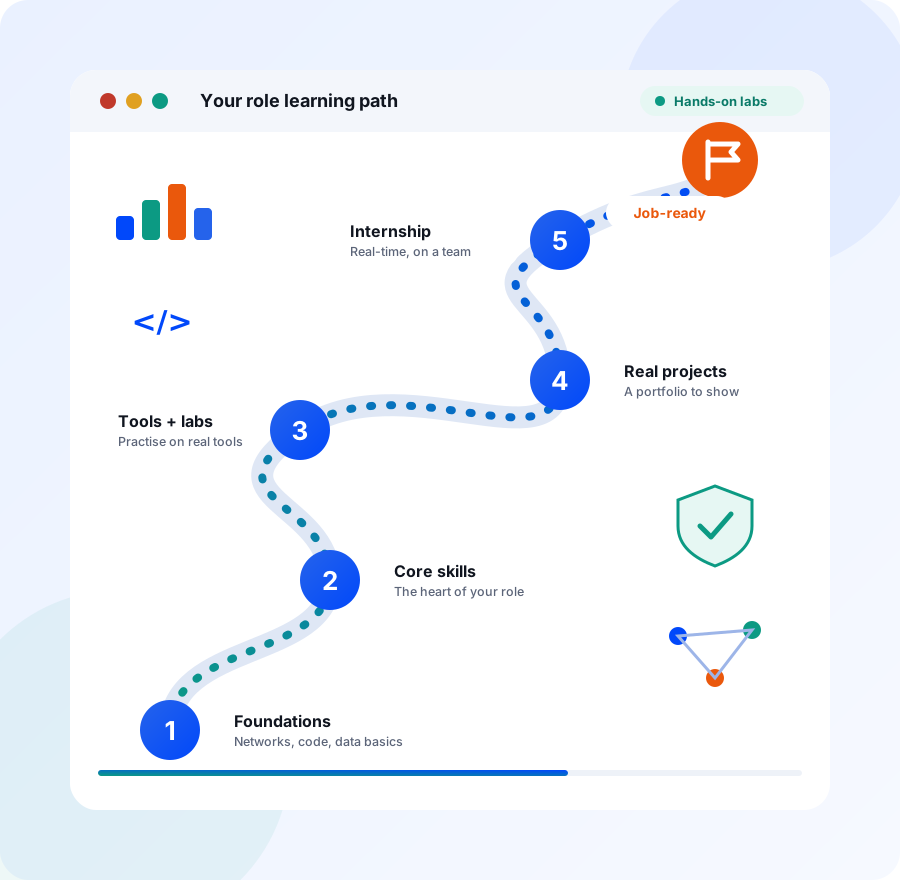
What a Analytics Consultant does
An analytics consultant helps a business decide something using data. A client may want to know why repeat purchases are falling or where to open the next branch. The consultant clarifies the question, studies the data, checks how sure the findings are and returns with a recommendation that a leadership team can act on. It is less about building tools and more about asking the right questions, staying honest about uncertainty and communicating well.
Week to week, you switch between talking to stakeholders and working in the data. A meeting narrows the question into a few hypotheses. You explore the data in a notebook, test the hypotheses and draw a few charts that hold up under questions. Then you build a dashboard or a short deck, rehearse the explanation and adjust after feedback. Sometimes a simple model helps, and sometimes the honest answer is that the data cannot say.
Analytics consultants work in consulting and IT services firms, product companies with internal analytics teams, banks, retail and healthcare organisations, and start-ups that need outside help with data. The role matters because a decision made on weak analysis can be expensive. A consultant who explains what the numbers show, and what they do not show, gives the client something they can rely on.
What you will be able to do
- Break a business problem into testable hypotheses and explore data to answer them.
- Use hypothesis testing and confidence intervals to state how sure a finding is.
- Analyse correlations and outliers without overstating what the data proves.
- Choose charts that fit the question and arrange them into a clear data story.
- Build and publish an interactive Power BI or Tableau dashboard around KPIs.
- Present insights to stakeholders in plain language and handle their questions.
- Explain when supervised or unsupervised learning helps and how to read its metrics.
- Write an exploratory findings brief that a client can read without opening the notebook.
Who this course is for
Final-year student or graduate
You like solving business puzzles as much as working with numbers. The course gives you statistics, charts and dashboards, and its projects give you finished pieces you can walk an interviewer through.
Working professional in sales, finance or operations
You know how a business runs and want to bring evidence into your recommendations. The statistics and dashboard modules let you support ideas with data and present them with more confidence.
IT services or support engineer
You have seen client requests from the delivery side and want a more advisory role. Learning analysis and presentation gives you a route toward client-facing analytics work.
Non-IT graduate
You are strong at communication and reasoning but new to data tools. Every technical step is taught from the start, and the presenting and storytelling practice suits your strengths.
What you will learn as a Analytics Consultant
These are the Data Science programme modules that matter most for this role, in the order that suits it. Every topic, tool and lab below is part of the programme syllabus.
Exploratory Data Analysis (EDA)
Module 4 · 20 HrsConsulting starts with a question, not a model. Practise hypothesis-driven exploration, profiling, spotting patterns and anomalies, and communicating early insights clearly, because this is how you decide what to tell a client first.
See the full module →What you study
- Univariate, bivariate & multivariate analysis
- Summary statistics & data profiling
- Identifying patterns, trends & anomalies
- Correlation analysis between variables
- Hypothesis-driven data exploration
- Communicating early insights clearly
Tools you use
PandasJupyter NotebookPandas ProfilingHands-on lab
Document and present exploratory findings in a clear, structured brief.
Mathematics for Data Science
Module 1 · 20 HrsClients ask how sure you are. Concentrate on hypothesis testing, confidence intervals, correlation and statistical inference, so you can say what the data supports and what it does not.
See the full module →What you study
- Probability & statistics fundamentals
- Descriptive statistics & distributions
- Hypothesis testing & confidence intervals
- Correlation & regression basics
- Statistical inference for data decisions
Tools you use
SciPyExcelHands-on lab
Apply combinatorics and probability theory to a real decision-making scenario.
Data Visualization (Matplotlib / Seaborn)
Module 5 · 20 HrsA finding nobody understands is wasted. Focus on visualisation principles, choosing the right chart, storytelling with data and small dashboards, and practise explaining each visual in one sentence.
See the full module →What you study
- Principles of effective data visualization
- Multi-panel & faceted visualizations
- Storytelling with data
- Choosing the right chart for the data
- Building simple visualization dashboards
Tools you use
MatplotlibSeabornPlotlyHands-on lab
Assemble a small visualization dashboard that tells a coherent data story.
Business Intelligence Tools (Power BI / Tableau)
Module 6 · 20 HrsClients keep dashboards long after the engagement. Concentrate on dashboard design, KPI tracking, drill-down analysis, publishing and above all presenting insights to a stakeholder audience.
See the full module →What you study
- BI concepts & dashboard design principles
- Connecting & importing data sources
- Building interactive dashboards & reports
- KPI tracking & drill-down analysis
- Publishing & sharing dashboards
- Presenting insights to stakeholders
Tools you use
Power BITableauExcelHands-on lab
Publish a dashboard and present its insights to a stakeholder audience.
Machine Learning Fundamentals
Module 7 · 30 HrsYou do not need to build every model, but you should know what one can do. Learn supervised and unsupervised learning, evaluation metrics and overfitting, so you can advise a client on whether prediction is worth trying.
See the full module →What you study
- Supervised vs. unsupervised learning
- Regression: linear & logistic
- Classification: KNN, Decision Trees, Random Forest
- Clustering: K-Means & hierarchical clustering
- Model evaluation: accuracy, precision, recall, F1
- Train-test split, cross-validation & overfitting
Tools you use
Scikit-learnPandasJupyter NotebookHands-on lab
Evaluate model performance using accuracy, precision, recall and F1 score.
What the programme covers for this role. The programme covers the analysis, statistics, dashboard and presentation parts of the role. Client management, business strategy and industry frameworks are outside the syllabus, so you build those through work experience.
Where a Analytics Consultant course can take you
Trainee level
Analytics Consultant (Trainee) is a listed starting point, along with Insights Analyst, Reporting Analyst and Business Intelligence Analyst roles, which build many of the same skills.
Core analytics roles
Analytics Consultant, Insights Analyst and Product Analyst sit in the programme's Analytics and Insights track. In these roles you own analysis for a client or a product team and present it to decision makers.
Longer-term paths
With years of experience and strong results, the programme's career map points toward Senior Data Scientist and Data Science Team Lead, and further out to Chief Data Officer.
Certifications the programme prepares you for
- Google Data Analytics Professional Certificate
- Microsoft Certified: Power BI Data Analyst Associate
- Tableau Desktop Specialist
Analytics Consultant course, quick answers
What does an analytics consultant do?
An analytics consultant turns a business question into an analysis and a recommendation. That means clarifying the problem, exploring the data, testing ideas with statistics, presenting the result in charts or a dashboard and explaining the limits to the people who will decide.
Do analytics consultants need to know machine learning?
Not always, but knowing the basics helps you advise clients. The programme covers regression, classification and clustering and how to evaluate them, which is enough to judge whether a prediction approach is worth trying for a problem.
Is coding required to become an analytics consultant?
Some coding is useful. Python with Pandas helps you explore data faster than a spreadsheet, and SQL helps you get it. The course teaches both from the start, alongside Power BI and Tableau, so you can pick the right tool for each task.
How is an analytics consultant different from a data analyst?
The tools overlap, but the emphasis differs. A data analyst often answers set questions for one team, while a consultant frames the question with stakeholders, argues for a recommendation and presents it. Communication and judgment count for more in the consulting role.
Which skills matter most when presenting to clients?
Clear structure, honest limits and simple visuals. Lead with the finding, show one chart that proves it and say how confident you are. The course practises this through storytelling, dashboard and stakeholder presentation work, so you rehearse before a real audience.
Get the Analytics Consultant Course Fee Structure & Syllabus
Share your details and our admissions team will call you back with the full syllabus, batch timings and fee breakdown.
Read before you decide
Other roles in the Data Science programme
Part of the Advanced Data Science Certification Program
Every role course follows the same Data Science programme, with the same modules, labs, projects and internship. See the full syllabus and every module.