
Same tools, different jobs
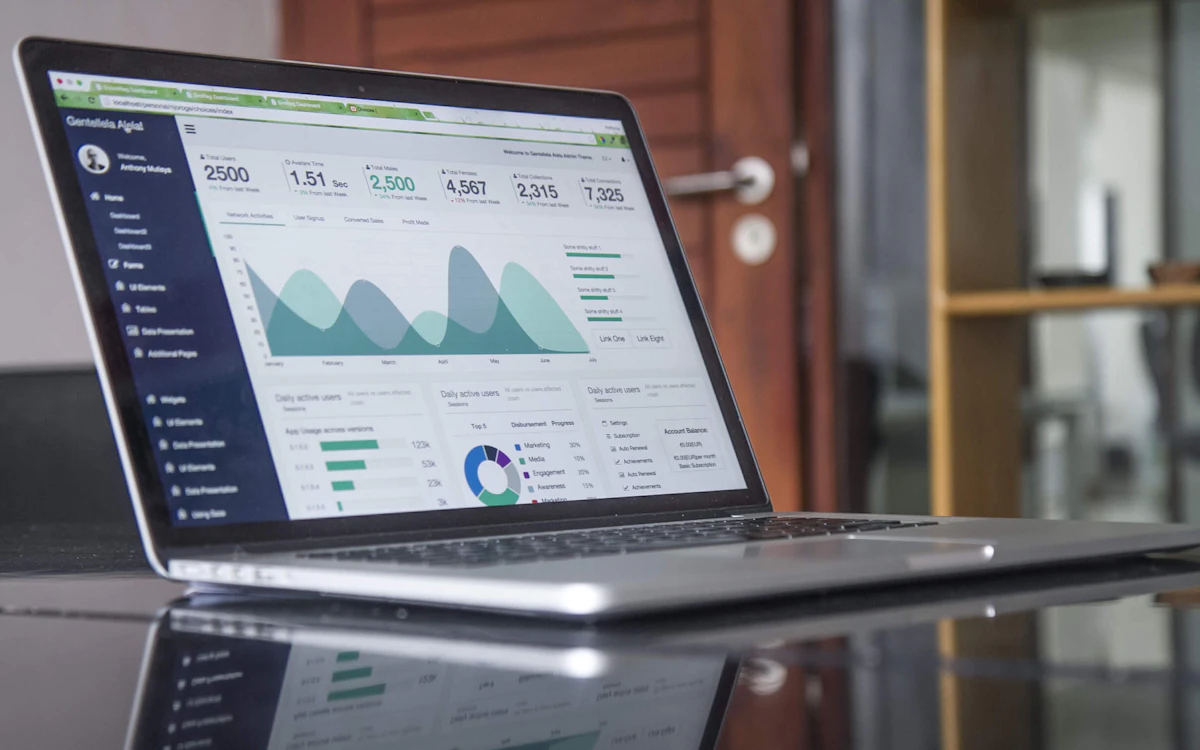
Almost every analytics job lists Excel, SQL and Power BI, which makes them look identical. The difference is what you do with those tools: answer one-off questions, build dashboards people use daily, produce reports that must be right every week, or translate between business teams and data.
This roadmap separates the shared foundation from each role's branch. For a month-by-month plan to your first interview, read our guide on how to become a data analyst in India.
Stage 2: the branch for each analytics role
Each branch matches a role page on our site.
Data Analyst
Deeper SQL, Python with Pandas for bigger data, charts with Matplotlib or Seaborn and clear written recommendations. First proof: an analysis that ends in a decision someone could act on.
BI Analyst
Power BI and Tableau data models, DAX measures and agreed KPI definitions. First proof: a dashboard with a documented KPI list.
Dashboard Developer
Advanced Power BI: data modelling, performance, row-level security and design that works on every screen. First proof: a multi-page report that loads fast on real data.
Reporting Analyst
Automated, accurate recurring reports in Excel, Power BI or Looker Studio, with checks that catch bad data. First proof: a weekly report that refreshes with one click.
Business Analyst
Requirements gathering, process mapping, user stories and using data to support business cases. First proof: a requirements document backed by your analysis.
Analytics Consultant
KPI frameworks, domain knowledge and presenting findings to decision makers. First proof: a capstone case study with recommendations.
Stage 3: where each analytics role leads
Common progressions after the first few years:
- Data Analyst → Senior Data Analyst → Analytics Manager, or a move into data science.
- BI Analyst → BI Developer → BI Manager → Head of BI.
- Dashboard Developer → Senior BI Developer → BI Architect.
- Reporting Analyst → MIS / Reporting Lead → Analytics Manager.
- Business Analyst → Senior Business Analyst → Product Manager or Product Owner.
- Analytics Consultant → Senior Consultant → Analytics Practice Lead.
Domain branches you can add to any role
The same skills open domain-specific titles once you know the business:
- Marketing and sales: Marketing Analyst, Sales Analyst, CRM Analyst.
- Operations: Operations Analyst, Supply Chain Analyst, Process Analyst.
- Product: Product Analyst and Insights Analyst in tech and e-commerce companies.
- Finance: FP&A and financial analyst roles that lean on Excel and SQL.
Which analytics branch suits your starting point
Your background often decides the fastest branch.
You like solving questions with numbers
The Data Analyst branch, with SQL and Python, gives you the most room to grow.
You enjoy design and visual work
BI Analyst and Dashboard Developer branches reward clean, usable dashboards.
You come from commerce, MBA or operations
Business Analyst and Analytics Consultant use your business sense straight away.
You are already in an MIS or Excel-heavy job
Reporting Analyst is a natural next step: add SQL and Power BI to what you already do.
Quick answers about the data analytics roadmap
Short answers to the roadmap questions analytics learners ask most.
What should I learn first for data analytics?
Excel and SQL. They appear in almost every analytics job, and Power BI or Python are much easier once you have them.
Is Power BI or Tableau better to learn?
Learn one well. Power BI is common in Indian companies; the concepts of data models, measures and visuals carry over to Tableau.
Do data analysts need Python?
Not for every role. Reporting and BI roles often do not, but Python with Pandas helps data analysts handle larger data and move into data science later.
What is the difference between a data analyst and a business analyst?
A data analyst answers questions with data. A business analyst defines what the business needs, using data as one input, and works closely with product and tech teams.
How is this roadmap different from the data science roadmap?
This one goes deeper into Excel, BI, reporting and KPIs. The data science roadmap adds machine learning, deployment and data engineering branches.
Go deeper on each analytics role
Open the role page for your branch, or read the guides that fill in each stage.
Build one thing for your branch this month
Take one public sales or HR dataset. Clean it in Excel, query it in SQL, then build the "first proof" for the branch you chose above. One finished, explained project says more to a recruiter than a list of tools.