
Analytics Consultant
Course in Hyderabad
A role-focused path through the Data Analytics Certification Program
This role course arranges the Data Analytics programme around an analytics consultant who frames a client's problem, explores the data and tells a clear story. You start with problem framing and exploration, then add visuals, KPIs and dashboards, and end with a domain project presented to stakeholders.
- Analytics lifecycle
- Hypothesis-driven analysis
- Data profiling
- Correlation analysis
- Storytelling with data
- KPI benchmarks
- Insight presentations
- Capstone case study
Same duration and fees as the Data Analyst programme.
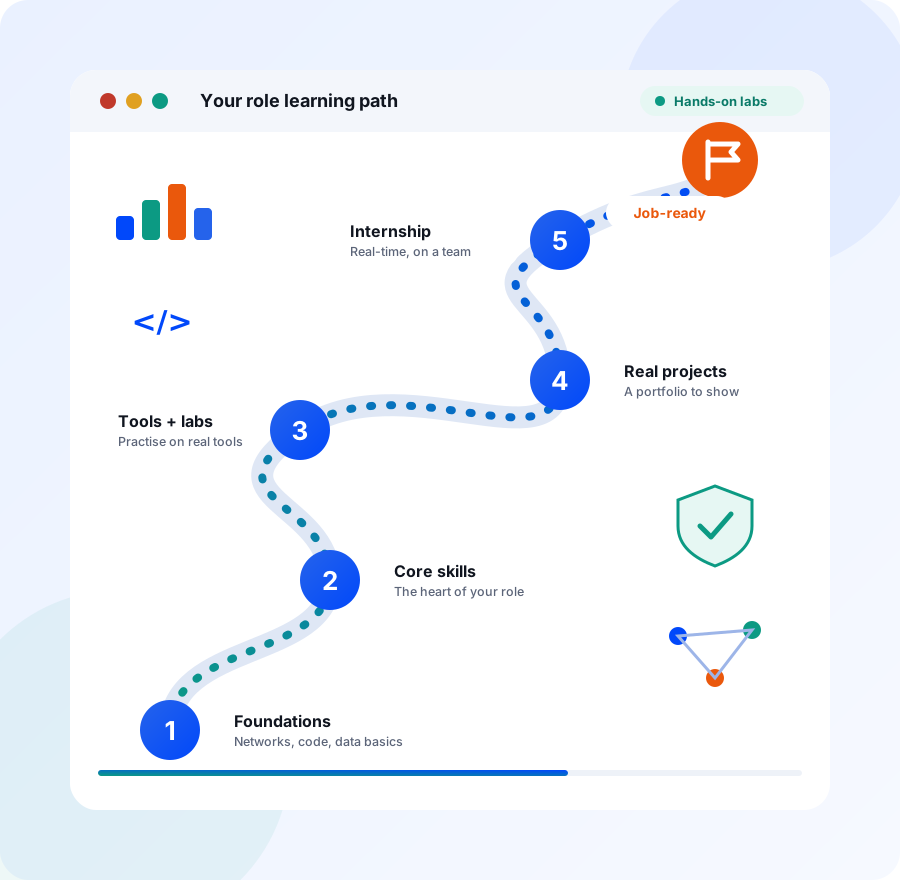
What a Analytics Consultant does
An analytics consultant is a problem solver who is brought in when a team knows something is wrong but cannot say what. It may be a fall in repeat customers or a cost that keeps rising. You define the question, decide which data can answer it, test a few ideas and return with a recommendation that the team can act on.
Work comes in projects rather than daily routines. You spend the first days framing the problem and gathering data, then explore it for patterns, test hypotheses and build a few visuals. The final stretch goes into shaping the story, presenting to stakeholders and handling their challenges. Then a new problem starts, often in a different domain, so you keep learning how each industry measures itself.
Analytics consultants work in consulting firms, IT services and analytics companies, and in the strategy or insights teams of larger businesses across retail, banking, healthcare and telecom. The role matters because good analysis is wasted if it does not change a decision, and consultants are trusted to connect the numbers to the choices leadership faces. Clear, honest presentation of what the data can and cannot say is a large part of that trust.
What you will be able to do
- Frame a business problem as an analytics project with scope, data needs and outputs.
- Explore a dataset with univariate, bivariate and multivariate analysis to test hypotheses.
- Find and explain correlations, outliers and anomalies without overstating what they prove.
- Build a chart set and a small dashboard that tells one coherent story.
- Set KPI benchmarks and targets that link to a client's stated goal.
- Present findings and recommendations to a non-technical audience with confidence.
- Complete an end-to-end capstone from raw data to a business recommendation.
Who this course is for
Final-year student
You like solving open problems and explaining your thinking. This path teaches you to frame a question, explore data and present a recommendation, which suits trainee consulting and analytics roles.
IT support engineer
You already diagnose problems for users. Here you learn to diagnose business problems with data: profiling, hypotheses, KPIs and a clear presentation that a manager can act on.
Non-IT graduate
Management, commerce and science graduates can use their domain knowledge here. You practise the analytics lifecycle from scratch, with no prior coding, and finish with a case study in a chosen sector.
Working professional
If colleagues already ask you what the numbers mean, this path adds structure: hypothesis-driven analysis, KPI benchmarks, storytelling and a full capstone you can present as proof of method.
What you will learn as a Analytics Consultant
These are the Data Analyst programme modules that matter most for this role, in the order that suits it. Every topic, tool and lab below is part of the programme syllabus.
Fundamentals of Data Analytics
Module 1 · 10 HrsConsulting starts with the question, not the tool. Concentrate on analytics types, the lifecycle, data-driven decision making and turning a vague request into a structured problem statement.
See the full module →What you study
- Types of analytics: descriptive, diagnostic, predictive, prescriptive
- The data analytics lifecycle
- Data-driven decision making
- Analytics tools landscape overview
- Structuring an analytics problem statement
Tools you use
ExcelPower BITableauHands-on project
Analytics Problem Framing Brief. Take a real business question and reframe it as a structured, answerable analytics problem statement.
Exploratory Data Analysis (EDA)
Module 4 · 10 HrsConsultants have to understand unfamiliar data quickly. Focus on data profiling, patterns and anomalies, correlation and hypothesis-driven exploration, and practise writing early insights clearly for a client.
See the full module →What you study
- Summary statistics & data profiling
- Identifying patterns, trends & anomalies
- Correlation analysis between variables
- Outlier detection techniques
- Hypothesis-driven data exploration
- Communicating early insights clearly
Tools you use
PandasJupyter NotebookPandas ProfilingHands-on lab
Analyse correlations between variables and surface early patterns.
Data Visualization (Matplotlib / Seaborn)
Module 5 · 20 HrsInsight only lands when people can see it. Focus on chart selection, storytelling with data and building a small set of visuals that lead the reader from question to answer.
See the full module →What you study
- Principles of effective data visualization
- Seaborn statistical plots & heatmaps
- Storytelling with data
- Choosing the right chart for the data
- Building simple visualization dashboards
Tools you use
MatplotlibSeabornPlotlyHands-on lab
Assemble a small visualization dashboard that tells a coherent data story.
KPI Tracking & Business Metrics
Module 8 · 10 HrsClients judge success through metrics. Concentrate on defining KPIs against business goals, setting benchmarks and targets, spotting design pitfalls and communicating performance, so your recommendations point to numbers a client already cares about.
See the full module →What you study
- Defining KPIs & business metrics
- Aligning metrics to business goals
- Setting benchmarks & targets
- Common pitfalls in KPI design
- Communicating metric performance
Tools you use
Power BITableauExcelHands-on lab
Present metric performance to a simulated stakeholder audience.
Business Intelligence Tools (Power BI / Tableau)
Module 6 · 20 HrsDashboards are often the deliverable a client keeps. Focus on dashboard design principles, KPI tracking, drill-down analysis and presenting insights to stakeholders in Power BI or Tableau.
See the full module →What you study
- BI concepts & dashboard design principles
- Building interactive dashboards & reports
- KPI tracking & drill-down analysis
- Publishing & sharing dashboards
- Presenting insights to stakeholders
Tools you use
Power BITableauHands-on lab
Design KPI tracking views for a sample business scenario.
Domain Knowledge + Capstone Projects
Module 9 · 10 HrsThe capstone is a rehearsal for a real engagement. Frame the problem, work with stakeholders and requirements, present to a non-technical audience and build a case study you can walk through.
See the full module →What you study
- Framing a business problem as an analytics project
- End-to-end capstone project execution
- Working with stakeholders & requirements
- Presenting findings to a non-technical audience
- Building a portfolio-ready case study
- Preparing for analytics interviews
Tools you use
ExcelSQLPower BIHands-on lab
Present the capstone project's findings to a non-technical stakeholder audience.
What the programme covers for this role. The programme prepares you for the trainee and junior end of analytics consulting. Client management, advisory experience and predictive modelling are outside its syllabus and grow through work on real engagements.
Where a Analytics Consultant course can take you
Entry roles
Analytics Consultant (Trainee), Insights Analyst, Business Analyst and Junior Data Analyst are typical starting titles, often in analytics teams that support several clients or business units.
Next steps
With experience you can move into Analytics Consultant, Product Analyst or Performance Analyst roles, where you lead small pieces of a project and present findings to stakeholders yourself.
Longer term
Senior Data Analyst, Analytics Manager and Head of BI (long-term) are the advanced steps in the programme's career tracks, adding team leadership and ownership of how a business measures itself.
Certifications the programme prepares you for
- IBM Data Analyst Professional Certificate
- Google Data Analytics Professional Certificate
- Microsoft Certified: Power BI Data Analyst Associate
Analytics Consultant course, quick answers
What does an analytics consultant do?
An analytics consultant helps a team understand a problem using data. You frame the question, explore the data, test ideas, and present a recommendation with charts and KPIs. Much of the work is communication and judgment, not only calculation.
Do I need machine learning to become an analytics consultant?
Not at the trainee and junior end of the role. This course focuses on exploration, KPIs, dashboards and storytelling. Predictive modelling is outside the syllabus, though it may be useful later as your projects grow.
How is an analytics consultant different from a data analyst?
A data analyst usually works inside one team on recurring questions. A consultant tends to handle open-ended problems in projects, often for several teams or clients, and spends more time framing, presenting and persuading. The core skills are shared.
How do I practise presenting to stakeholders during the course?
Several labs are built around it: presenting exploratory findings, presenting metric performance to a simulated stakeholder audience, and presenting the capstone to a non-technical group. You get repeated practice instead of a single final talk.
Which industries can I build my consulting case study in?
The capstone lab names retail, finance, healthcare and marketing as sample domains. Pick the one that matches the roles you want, and describe the business problem, data, method and recommendation in a portfolio-ready write-up.
Get the Analytics Consultant Course Fee Structure & Syllabus
Share your details and our admissions team will call you back with the full syllabus, batch timings and fee breakdown.
Read before you decide
Other roles in the Data Analyst programme
Part of the Advanced Data Analytics Certification Program
Every role course follows the same Data Analyst programme, with the same modules, labs, projects and internship. See the full syllabus and every module.