
Reporting Analyst
Course in Hyderabad
A role-focused path through the Data Analytics Certification Program
This role course arranges the Data Analytics programme around a reporting analyst who delivers the same accurate reports on time, every cycle. You begin with report structure and automation, sharpen Excel and SQL for data pulls, add profiling and quality checks, then present in Power BI.
- Report structuring
- Report automation
- Excel formulas
- Power Query
- SQL data pulls
- Report QA checks
- Executive summaries
- Power BI reports
Same duration and fees as the Data Analyst programme.
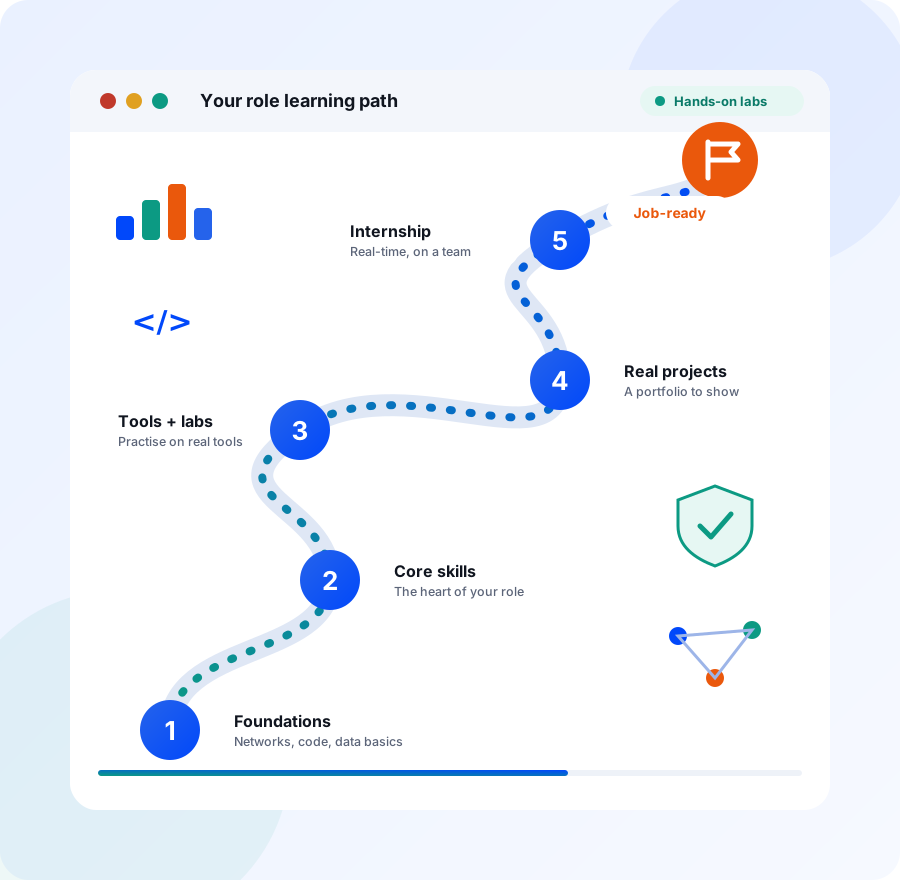
What a Reporting Analyst does
A reporting analyst produces the regular numbers a business runs on: the daily sales flash, the weekly operations pack, the month-end performance summary. The core skill is reliability. The same report must arrive on time, use the same definitions every cycle and match the source. Speed matters, but a wrong number in a leadership pack costs more trust than a late one.
Your week is shaped by a calendar. Early days go to refreshing data, running the pulls and comparing totals with the last period. Midweek you fix mismatches, answer questions from report readers and add a column someone asked for. Later you finalise the pack with an executive summary, check it once more, send it, and note lessons for the next cycle.
Reporting analysts work in finance, sales operations, HR, supply chain, customer service and MIS teams in almost every industry. Their reports feed budgeting meetings, review calls and performance conversations. When reporting is tidy and repeatable, managers stop rebuilding numbers by hand and spend that time acting on them. It is quiet work, but reporting analysts are often the people whose consistency the rest of the business relies on.
What you will be able to do
- Structure a business report so both technical and non-technical readers can follow it.
- Automate and schedule a recurring report using Power BI or Excel.
- Clean and validate a raw extract with Excel formulas, Power Query and data validation.
- Write SQL reporting queries that aggregate data by period, team and product.
- Combine several data sources into one coherent report that ties back to the source.
- Run profiling and accuracy checks that catch missing values and odd totals early.
- Present a report to leadership and answer questions on how each number was built.
Who this course is for
Final-year student
You want a first job with a clear routine and a defined tool set. Reporting roles reward accuracy and Excel skill, and this path lets you practise both on real datasets before you graduate.
IT support engineer
You are used to checking whether a system did what it should. That habit transfers to report checks, where you compare totals, trace mismatches and document what changed each cycle.
Non-IT graduate
If you studied commerce or science, the Excel and SQL modules give you a practical base, and the reporting module shows how to structure a pack that managers can read quickly.
Working professional
You may already compile the monthly MIS by hand. This path helps you automate it, add data checks, and move the work into a scheduled Power BI or Excel report.
What you will learn as a Reporting Analyst
These are the Data Analyst programme modules that matter most for this role, in the order that suits it. Every topic, tool and lab below is part of the programme syllabus.
Business Reporting & Dashboards
Module 7 · 10 HrsThis is the heart of the role, so it comes first. Learn how to structure a report, automate and schedule it, write an executive summary, and run QA checks before anything reaches leadership.
See the full module →What you study
- Structuring effective business reports
- Report automation & scheduling
- Designing dashboards for different audiences
- Executive summary writing
- Version control for recurring reports
- Report QA & accuracy checks
- Presenting reports to leadership
Tools you use
Power BIExcelGoogle Data StudioHands-on project
Business Reporting Lab. Build and automate a recurring business report with KPIs and an executive summary.
Excel for Data Analysis
Module 2 · 20 HrsMost reporting packs still live in Excel. Concentrate on formulas, lookups, pivot tables and Power Query, which let you refresh a report instead of rebuilding it by hand every cycle.
See the full module →What you study
- Excel formulas & functions for analysis
- Pivot tables & pivot charts
- Data cleaning with Excel
- VLOOKUP, XLOOKUP & INDEX-MATCH
- Conditional formatting & data validation
- Automating tasks with basic macros
Tools you use
ExcelPower QueryGoogle SheetsHands-on lab
Clean and prepare a messy dataset using Excel formulas and data validation.
SQL for Data Analysis
Module 3 · 20 HrsReports are only as fresh as the data pulled into them. Focus on filtering, joins, aggregates and writing queries for business reporting, and learn basic query tuning so pulls run reliably.
See the full module →What you study
- SELECT, WHERE, ORDER BY & filtering data
- JOIN, GROUP BY & aggregate functions
- Subqueries & CTEs
- Writing queries for business reporting
- Query optimization fundamentals
Tools you use
SQLMySQL / PostgreSQLpgAdminHands-on lab
Write and optimise a business reporting query against a real database.
Exploratory Data Analysis (EDA)
Module 4 · 10 HrsProfiling is your safety net. Learn summary statistics, data profiling and how to handle missing or skewed data, so you catch odd values before they appear in a report.
See the full module →What you study
- Univariate, bivariate & multivariate analysis
- Summary statistics & data profiling
- Outlier detection techniques
- Handling missing & skewed data
Tools you use
PandasPandas ProfilingJupyter NotebookHands-on lab
Profile a real business dataset and summarise its structure and quality.
Business Intelligence Tools (Power BI / Tableau)
Module 6 · 20 HrsOnce the reporting basics are steady, move them into Power BI. Focus on connecting sources, interactive reports, KPI tracking and publishing, so readers can explore for themselves instead of asking for new extracts.
See the full module →What you study
- BI concepts & dashboard design principles
- Connecting & importing data sources
- Building interactive dashboards & reports
- KPI tracking & drill-down analysis
- Publishing & sharing dashboards
Tools you use
Power BIExcelHands-on lab
Publish a dashboard and present its insights to a stakeholder audience.
What the programme covers for this role. The programme covers Excel, SQL, report structure, automation and BI tools. Domain-specific reporting such as statutory or regulatory returns is outside its syllabus and is learned on the job.
Where a Reporting Analyst course can take you
Entry roles
Reporting Analyst, Excel Analyst, SQL Analyst and Data Analyst (Trainee) roles are common starting points, with Operations Analyst (Junior) positions in teams that report on daily process numbers.
Next steps
With experience you can move into Business Intelligence Analyst, Dashboard Developer or Performance Analyst roles, where you build and own dashboards rather than only running recurring packs.
Longer term
Long-term options include Senior Data Analyst, Analytics Manager and Head of BI (long-term), as you take on report governance, metric ownership and a wider team of analysts.
Certifications the programme prepares you for
- Microsoft Excel Expert Certification
- Microsoft Certified: Power BI Data Analyst Associate
- Google Data Analytics Professional Certificate
Reporting Analyst course, quick answers
What does a reporting analyst do?
A reporting analyst prepares recurring reports such as daily sales, weekly operations and monthly performance packs. You pull data, check it, apply the agreed definitions, add a short summary and send it on time, then answer questions from readers.
Is Excel enough for a reporting analyst role?
Excel is the base, but many teams also expect SQL for data pulls and a BI tool such as Power BI for dashboards. This course covers all three, along with Power Query for cleaning and refreshing data.
How can I automate reports without advanced coding?
The course teaches scheduling and refresh in Power BI or Excel, Power Query for repeatable cleaning, and basic macros. These cover most routine packs without writing programs, and you learn where automation is worth the effort.
How do reporting analysts make sure the numbers are right?
By building checks into the routine: compare totals with the source and with the last period, profile the data for missing or odd values, review joins and filters, and keep versions of the report. The course has a QA lab for this.
Is reporting analyst a good first job for a fresher?
It is a common entry point because the tasks are clear and the tools are Excel, SQL and a BI tool. Careful work in a reporting role also builds the habits needed for later analyst and BI roles.
Get the Reporting Analyst Course Fee Structure & Syllabus
Share your details and our admissions team will call you back with the full syllabus, batch timings and fee breakdown.
Read before you decide
Other roles in the Data Analyst programme
Part of the Advanced Data Analytics Certification Program
Every role course follows the same Data Analyst programme, with the same modules, labs, projects and internship. See the full syllabus and every module.