
BI Analyst
Course in Hyderabad
A role-focused path through the Data Analytics Certification Program
This role course arranges the Data Analytics programme around the work of a BI analyst who keeps dashboards trusted and useful. You start with the SQL that feeds reports, then learn Power BI and Tableau, KPI design and recurring reporting, before practising chart choices for busy readers.
- SQL reporting queries
- Power BI reports
- DAX measures
- Tableau dashboards
- KPI scorecards
- Drill-down analysis
- Dashboard design
- Report scheduling
Same duration and fees as the Data Analyst programme.
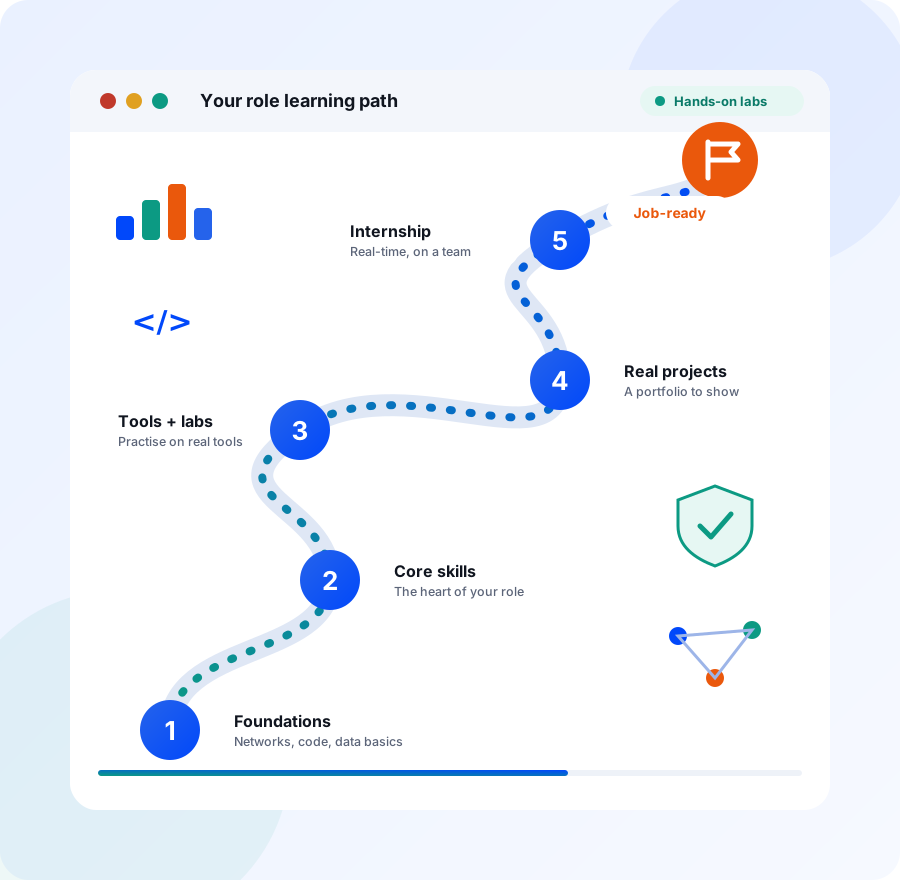
What a BI Analyst does
A BI analyst looks after the dashboards a company uses to run itself. Where a general analyst answers one-off questions, a BI analyst builds views that are refreshed and read every day: sales by branch, stock against target, support tickets by team. The job is part query writing, part design and part listening, because a dashboard only works when the people using it agree on what each number means.
Week to week, you tune the queries behind existing reports, add a filter or a drill-down that a manager asked for, and check that a total on the dashboard still matches the source system. You meet a department head to agree a new KPI, sketch the layout on paper, build it in Power BI or Tableau and collect feedback after the first week of use.
BI analysts sit in reporting or analytics teams inside retail, banking, healthcare, telecom, manufacturing and IT services firms across Hyderabad. Their work matters because dashboards replace long email chains and monthly slide decks. When the numbers are consistent and easy to filter, teams argue less about whose figure is right and spend more time on the decision. That is why companies keep investing in people who can maintain them well.
What you will be able to do
- Write SQL joins, CTEs and window functions that feed reports with exactly the numbers needed.
- Connect several data sources in Power BI and shape them into one report.
- Create DAX measures and Tableau calculated fields for ratios, totals and time comparisons.
- Design KPI scorecards with targets, benchmarks and a clear owner for each metric.
- Build drill-down dashboards that let a manager move from summary to detail in a few clicks.
- Choose the right chart for a question and defend that choice to a stakeholder.
- Schedule a recurring report and run accuracy checks before it reaches leadership.
Who this course is for
Final-year student
You like charts and tidy tables and want a role with a clear tool stack. The path gives you SQL, Power BI and Tableau in a sensible order, plus dashboards you can show in interviews.
IT support engineer
You know how systems behave and how users complain. That helps in BI work, where you learn to connect sources, keep refreshes stable and explain why a number changed on a screen.
Non-IT graduate
You may know a business area such as retail or finance but not databases. SQL is taught from the basics, and the design rules and KPIs you practise can come from your own domain.
Working professional
If you are an MIS or reporting executive, you likely maintain sheets by hand. This path moves you toward shared dashboards, DAX measures and scheduled reports that others can explore themselves.
What you will learn as a BI Analyst
These are the Data Analyst programme modules that matter most for this role, in the order that suits it. Every topic, tool and lab below is part of the programme syllabus.
SQL for Data Analysis
Module 3 · 20 HrsEvery dashboard is only as good as the query behind it. Focus on joins, CTEs, window functions and query tuning, so that your reports load quickly and return the numbers stakeholders expect.
See the full module →What you study
- JOIN, GROUP BY & aggregate functions
- Subqueries & CTEs
- Window functions for analysis
- Writing queries for business reporting
- Database design basics
- Query optimization fundamentals
Tools you use
SQLMySQL / PostgreSQLpgAdminHands-on lab
Write and optimise a business reporting query against a real database.
Business Intelligence Tools (Power BI / Tableau)
Module 6 · 20 HrsThis is the core of the role. Learn dashboard design principles first, then build in both Power BI and Tableau, paying most attention to DAX basics, calculated fields, drill-down and sharing.
See the full module →What you study
- BI concepts & dashboard design principles
- Connecting & importing data sources
- Building interactive dashboards & reports
- DAX basics in Power BI
- Calculated fields & filters in Tableau
- KPI tracking & drill-down analysis
- Publishing & sharing dashboards
Tools you use
Power BITableauExcelHands-on lab
Build an interactive Power BI report using DAX measures and filters.
KPI Tracking & Business Metrics
Module 8 · 10 HrsChoosing the right metric is half of BI work. Practise defining KPIs, setting targets and benchmarks, and naming an owner for each, then build a scorecard that a leader can read in a minute.
See the full module →What you study
- Defining KPIs & business metrics
- Aligning metrics to business goals
- Building KPI dashboards & scorecards
- Setting benchmarks & targets
- Metric ownership & governance
- Common pitfalls in KPI design
Tools you use
Power BITableauExcelHands-on project
KPI Scorecard Build. Define, track and present a KPI scorecard aligned to a real business goal.
Data Visualization (Matplotlib / Seaborn)
Module 5 · 20 HrsThe chart rules learned here in Python apply equally in Power BI and Tableau. Concentrate on choosing the right chart, faceted views and telling a story across a set of visuals.
See the full module →What you study
- Principles of effective data visualization
- Multi-panel & faceted visualizations
- Storytelling with data
- Choosing the right chart for the data
- Building simple visualization dashboards
Tools you use
MatplotlibSeabornPlotlyHands-on lab
Choose and justify the right chart type for a given business question.
Business Reporting & Dashboards
Module 7 · 10 HrsReports have to arrive on time and stay correct. Focus on automation and scheduling, designing views for different audiences, and QA checks that catch broken totals before leadership sees them.
See the full module →What you study
- Report automation & scheduling
- Designing dashboards for different audiences
- Combining multiple data sources into one report
- Report QA & accuracy checks
- Presenting reports to leadership
Tools you use
Power BIExcelGoogle Data StudioHands-on lab
Automate and schedule a recurring report using Power BI or Excel.
What the programme covers for this role. The programme teaches Power BI and Tableau dashboarding, DAX basics and KPI work. Data warehouse design, ETL engineering and advanced DAX modelling are outside its syllabus.
Where a BI Analyst course can take you
Entry roles
Business Intelligence Analyst (Junior), BI Developer (Entry), Dashboard Developer and Data Analyst are common starting points. These roles usually focus on maintaining reports, building views and answering questions from one department.
Next steps
With a year or two of experience, you can move into BI Analyst, Performance Analyst or Insights Analyst work, owning a set of dashboards and KPIs for a function or a business unit.
Longer term
Senior Data Analyst, Analytics Manager and Head of BI (long-term) sit at the end of the advanced track, with more ownership of metric definitions, data quality and the direction of a team.
Certifications the programme prepares you for
- Microsoft Certified: Power BI Data Analyst Associate
- Tableau Desktop Specialist
- Google Data Analytics Professional Certificate
BI Analyst course, quick answers
What is the difference between a BI analyst and a data analyst?
A data analyst often answers one-off questions with exploration and a report. A BI analyst maintains dashboards and KPIs that people use every day. The skills overlap, but BI work leans more on tools, refresh reliability and metric definitions.
Should a BI analyst learn Power BI or Tableau first?
Either works, and the concepts carry over. The BI module teaches both, so you can compare them. Start with the tool that most job posts in your target area mention, then rebuild the same dashboard in the other to see the differences.
Do BI analysts really need SQL?
In most teams, yes. Dashboards pull from databases, and SQL lets you shape the data before it reaches the report. The course covers joins, CTEs, window functions and basic query tuning, which are the parts BI work uses most.
What is DAX and how much of it do I need?
DAX is the formula language in Power BI for measures such as totals, ratios and year-to-date figures. This course teaches DAX basics, enough to build useful reports. Advanced data modelling is a next step you can take on the job.
What should a BI analyst portfolio contain?
Show a BI Dashboard Build, a KPI Scorecard Build and a Business Reporting Lab, each with a short note on the question, the metrics and the design choices. Recruiters like to see why a chart was chosen, not only the chart.
Get the BI Analyst Course Fee Structure & Syllabus
Share your details and our admissions team will call you back with the full syllabus, batch timings and fee breakdown.
Read before you decide
Other roles in the Data Analyst programme
Part of the Advanced Data Analytics Certification Program
Every role course follows the same Data Analyst programme, with the same modules, labs, projects and internship. See the full syllabus and every module.